What Is a Manufacturing Carbon Footprint?
A manufacturing carbon footprint is the total volume of greenhouse gases (GHGs) emitted directly and indirectly by a factory's operations. It is expressed in CO₂ equivalents (CO₂e) , which standardizes the impact of different gases,carbon dioxide (CO₂), methane (CH₄), nitrous oxide (N₂O), and refrigerants,into a single, comparable metric.
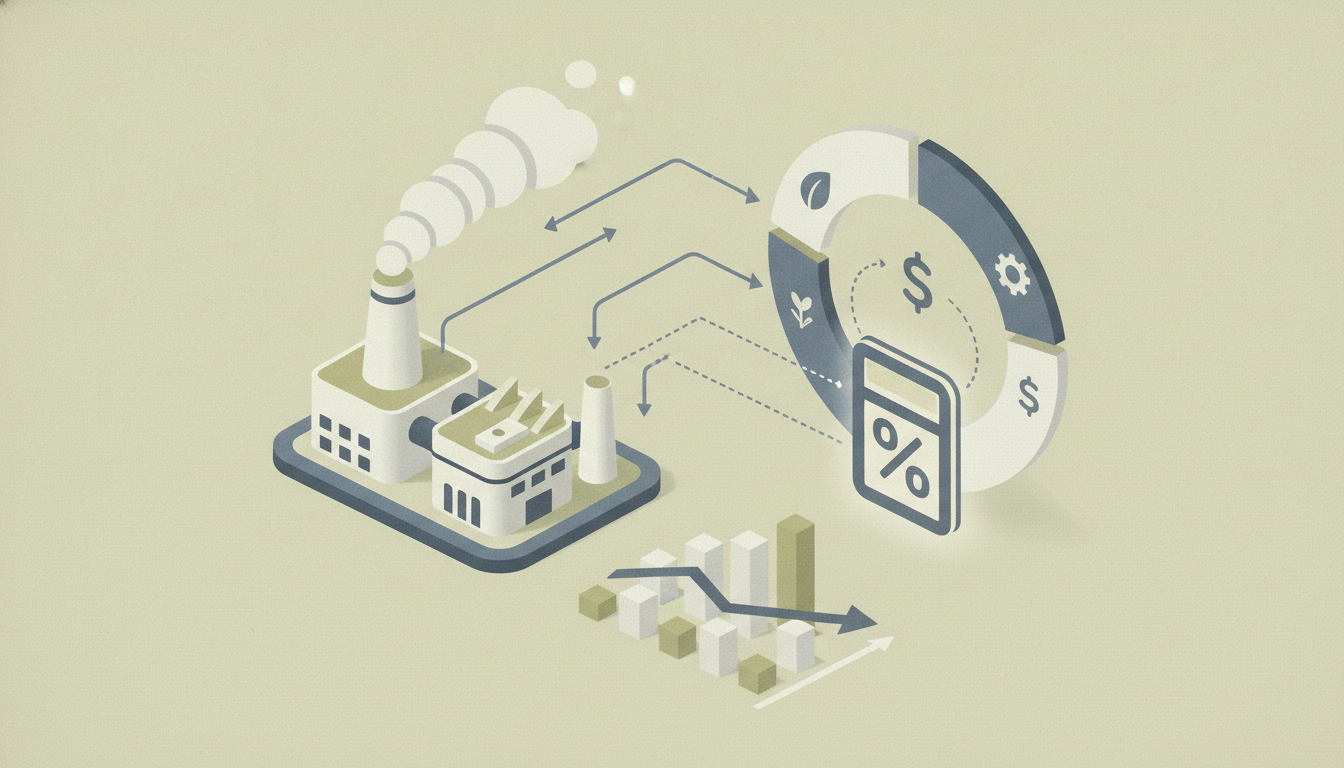
Think of it as the exhaust you can't see. Every time your factory burns natural gas for heat, powers a conveyor belt with grid electricity, or leaks refrigerant from an aging chiller, it adds to your carbon footprint. Unlike a car's tailpipe, factory emissions are spread across hundreds of processes and sources.
Carbon accounting distinguishes between two broad categories:
- Direct emissions from sources you own and control, such as a diesel generator or a boiler.
- Indirect emissions from energy you buy (electricity, steam, heat) or from activities in your value chain.
Understanding this baseline is the foundation of any reduction strategy. Without measuring your carbon footprint, you cannot manage it. And with regulatory bodies like the Securities and Exchange Commission in the U.S. and the European Union's Emissions Trading System tightening rules on corporate reporting, ignorance is no longer a viable option.
A practical example: A medium-sized injection molding facility consuming 5 million kWh of electricity per year and 200,000 therms of natural gas will have a combined footprint of roughly 3,500 metric tons of CO₂e from scopes 1 and 2 alone. Add upstream material production, and that number can triple.
Why Calculate Your Factory's Carbon Footprint?
You might be wondering: "Why invest time and resources into this calculation when I have production targets to meet?" The answer is straightforward,carbon footprint calculation directly impacts your bottom line, regulatory standing, and market position.
Regulatory compliance is the most pressing driver. In the United Kingdom, the Streamlined Energy and Carbon Reporting (SECR) framework requires large companies to disclose their energy use and GHG emissions. In the EU, manufacturers face mandatory reporting under the European Sustainability Reporting Standards (ESRS). Failing to comply results in fines, reputational damage, and exclusion from public procurement tenders. Even if you aren't directly regulated, your customers likely are,and they'll demand your data.
Customer and investor demands have intensified dramatically. Take the example of Unilever, which requires its top 500 suppliers to report their carbon footprints annually. Similarly, automotive giants like Volkswagen and BMW mandate detailed emissions reporting from their tier 1 and 2 suppliers. If you cannot provide accurate numbers, you risk losing contracts worth millions.
But there is a hidden upside: cost savings. When you map your carbon footprint, you inevitably find energy waste. A food processing plant in the Netherlands discovered that its compressed air system was leaking 30% of the air produced, equivalent to EUR 45,000 in annual electricity costs,a leak that was invisible until they calculated their scope 2 emissions. The payback period for fixing the leaks was three weeks.
Finally, a credible carbon footprint is a competitive advantage. Manufacturers with verified low-carbon products can command price premiums. In a 2023 survey by Boston Consulting Group, 67% of industrial buyers said they would pay up to 15% more for low-carbon materials.
| Driver | Immediate Benefit | Long-Term Advantage |
|---|---|---|
| Regulation | Avoid penalties and fines | Future-proof against carbon taxes |
| Customer demand | Retain and win key contracts | Differentiate in crowded markets |
| Cost savings | Identify energy waste | Reduce operating expenses by 10-30% |
| Brand reputation | Attract eco-conscious customers | Access green investment funds |
Understanding Scope 1, 2, and 3 Emissions
The GHG Protocol, the global standard for carbon accounting, splits emissions into three categories called "scopes." This framework ensures consistency across companies and industries.
Scope 1: Direct Emissions from Owned Sources
Scope 1 covers direct emissions from sources you own or control. These are the most straightforward to calculate because you have full visibility into their operation.
Common examples in manufacturing:
- Natural gas burned in boilers, furnaces, or ovens
- Diesel or petrol used in forklifts, trucks, or generators
- Refrigerant leakage from cooling systems
- Chemical reactions that release CO₂ during production (e.g., cement kilns or ammonia synthesis)
For a typical automotive parts manufacturer, scope 1 might comprise 30% of total emissions. The calculation is simple: multiply fuel consumption (in kWh or liters) by the appropriate emission factor.
Scope 2: Indirect Emissions from Purchased Energy
Scope 2 accounts for indirect emissions from the electricity, steam, heat, or cooling you buy from a utility provider. Even though you don't burn the fuel, you are responsible for the emissions caused by generating that energy.
Why this matters: A factory in Poland, where coal-fired power plants dominate, will have a much higher scope 2 footprint per kWh than an identical plant in France, where nuclear and renewables provide most electricity. If you sign a Power Purchase Agreement (PPA) with a wind farm, your scope 2 emissions effectively drop to zero for that portion of electricity.
The calculation uses two methods:
- Location-based: Using the average grid emission factor for your region
- Market-based: Using specific emission factors from your utility contract or energy attribute certificates
For most manufacturers, scope 2 is the largest single source, often 40-60% of total footprint.
Scope 3: All Other Indirect Emissions
Scope 3 is the most complex and often the largest category. It includes all other indirect emissions in your value chain, both upstream and downstream.
The GHG Protocol identifies 15 categories for scope 3, but manufacturers typically focus on:
- Purchased goods and services: Raw materials, components, packaging
- Upstream transportation: Inbound logistics from suppliers
- Waste generated in operations: Landfill, recycling, incineration
- Business travel and employee commuting: Flights, cars, public transport
- Downstream transportation and distribution: Outbound logistics
- Use of sold products: Energy consumed by customers using your product
- End-of-life treatment of sold products: Disposal or recycling of your product
Scope 3 can account for 70-90% of a manufacturer's total footprint. A semiconductor fabrication plant, for example, might find that purchasing high-purity silicon wafers and specialty gases accounts for more emissions than all its direct operations combined.
| Scope | Type | Examples | Typical Manufacturing Share |
|---|---|---|---|
| 1 | Direct, owned | Boilers, vehicles, refrigerant leaks | 10-30% |
| 2 | Indirect, purchased | Grid electricity, district heating | 20-40% |
| 3 | Indirect, value chain | Raw materials, logistics, product use | 40-80% |
Step 1: Define Your Organizational and Operational Boundaries
Before you collect a single data point, you must decide which parts of your business to include. This decision follows the GHG Protocol and involves two types of boundaries.
Choosing a Consolidation Approach
The GHG Protocol offers three consolidation methods for companies with multiple facilities, joint ventures, or subsidiaries:
- Equity share: Report emissions proportional to your ownership stake. If you own 40% of a joint venture, report 40% of its emissions.
- Financial control: Report 100% of emissions from entities where you control financial policies, even if you own less than 50%.
- Operational control: Report 100% of emissions from facilities where you control day-to-day operations.
For most manufacturers, operational control is the most practical approach. It aligns with your operational decision-making and is widely accepted by reporting frameworks like CDP and the Science Based Targets initiative (SBTi).
Practical scenario: You own 100% of your main plant but have a 30% stake in a raw material processing joint venture. With operational control, you include only your main plant unless you manage the joint venture's daily operations.
Setting Operational Boundaries
Once the organizational boundary is set, define the operational boundary,which emission sources and scopes to include.
Start by mapping all emission sources in your facility:
- Fuel combustion (natural gas, diesel, propane, coal)
- Process emissions (chemical reactions releasing GHGs)
- Refrigerant use (HVAC systems, industrial chillers)
- Purchased electricity, steam, heat, and cooling
- Mobile sources (forklifts, trucks, company vehicles)
For a typical metal fabrication shop, this list might include: three natural gas furnaces, two diesel forklifts, an electric arc furnace, grid electricity for lighting and machinery, and an air conditioning system using R-410A refrigerant.
Pro tip: Create a simple diagram of your facility with all energy inputs and emission sources identified. This visual map prevents you from missing anything.
Step 2: Collect Activity Data
Activity data is the raw input for your carbon calculation. It answers the question: "How much fuel, electricity, or material did we consume?" The quality of your data directly determines the accuracy of your footprint.
Gathering Scope 1 Emissions Data
For scope 1, collect records of all fuels combusted and refrigerants used.
Fuels: Pull data from purchase invoices, fuel delivery logs, or tank level readings. Record quantities in their native units (liters, kilograms, therms, or kWh) and ensure consistency over the reporting period (typically a calendar or fiscal year).
Example: Your plant's natural gas supplier provides monthly invoices showing therm usage. Sum these for the year to get total annual consumption. For diesel forklifts, track fuel purchases from the pump,your dispatch log should show this.
Refrigerants: Record the type and quantity of refrigerant added to systems during maintenance, as well as the type and quantity removed during disposal. The net difference is your leakage.
Concrete example: An injection molding facility found it was losing 150 kg of R-134a annually. With a Global Warming Potential (GWP) of 1,430, this single refrigerant leak added 214 metric tons CO₂e,equivalent to operating 46 cars for a year.
Gathering Scope 2 Emissions Data
Scope 2 relies primarily on electricity consumption data. Utility invoices provide the most accurate data, but smart meters offer real-time granularity.
Electricity: Collect monthly utility bills showing kWh consumption. If your facility has sub-meters for specific production lines, aggregate these to verify total consumption.
Steam and district heating: Request thermal energy delivery records from your utility provider. These are typically measured in megawatt-hours (MWh) or gigajoules (GJ).
Practical tip: When pulling data from multiple facilities, use a standardized template. This simplifies aggregation and reduces errors.
Gathering Scope 3 Emissions Data
Scope 3 data collection is inherently more complex because it involves external parties.
Purchased goods: Work with your procurement team to compile quantities of raw materials and components purchased. Categorize them by type (steel, plastic, chemicals, electronic components) to apply appropriate emission factors.
Upstream transportation: Request distance and mode data from logistics providers. If exact data is unavailable, use spend-based estimates initially and refine over time.
Waste: From waste disposal contractors, obtain tonnage data by disposal method (landfill, recycling, incineration with energy recovery).
Initial approach: If data gaps seem overwhelming, start with the largest categories. For most manufacturers, purchased goods and services and upstream transportation represent the bulk of scope 3 emissions.
| Data Type | Source | Unit | Typical Frequency |
|---|---|---|---|
| Natural gas | Utility bill | Therms or kWh | Monthly |
| Electricity | Utility bill or meter | kWh | Monthly |
| Diesel | Fuel delivery log | Liters | Per delivery |
| Refrigerant | Maintenance records | kg | Annually |
| Raw materials | Purchase orders | Metric tons | Quarterly |
| Waste | Contractor reports | Metric tons | Monthly |
Step 3: Apply Emission Factors
Activity data alone tells you nothing about emissions. You need emission factors,conversion coefficients that translate activity data into CO₂e.
Where to Find Reliable Emission Factors
Authoritative sources provide emission factors specific to different fuels, electricity grids, and processes. The most widely used databases include:
- IPCC (Intergovernmental Panel on Climate Change) : Default factors for global use, suitable when country-specific data is unavailable.
- DEFRA (UK Department for Environment, Food & Rural Affairs) : Updated annually with factors for UK operations, including transport, energy, and waste.
- EPA (US Environmental Protection Agency) : eGRID factors for electricity by region, plus factors for common fuels.
- International Energy Agency (IEA) : Country-level electricity factors.
- GHG Protocol: Provides guidance on selecting and applying factors.
How to choose: Always use the most specific factor available. For example, use a country-specific grid emission factor rather than a global average. If your country publishes a grid factor, use that. If not, the IPCC default regional factor is acceptable.
Example calculation: Your factory consumed 1,000,000 kWh of grid electricity in Germany. The German grid emission factor in 2024 is approximately 0.35 kg CO₂e per kWh (location-based). The calculation:
1,000,000 kWh × 0.35 kg CO₂e/kWh = 350,000 kg CO₂e = 350 metric tons CO₂e
Critical reminder: Emission factors change annually as grids decarbonize. Using a factor from 2020 for 2024 data will overstate your footprint. Always check the vintage of your factors.
Step 4: Calculate Your Total Carbon Footprint
Now you bring it all together. This step involves multiplying each activity data point by its corresponding emission factor and summing across all sources.
Common Calculation Mistakes to Avoid
Even experienced sustainability managers make errors. Here are the most frequent pitfalls:
1. Overlooking refrigerant leakage: Many manufacturers track refrigerant only when they change out an entire chiller, missing the routine top-offs that indicate continuous leakage. Record every recharge.
2. Double-counting biogenic CO₂: Emissions from burning biomass (wood pellets, agricultural waste) are often reported differently. Under IPCC guidelines, biogenic CO₂ from sustainably sourced biomass is excluded from scope 1, but methane (CH₄) and nitrous oxide (N₂O) from the same combustion must be included.
3. Using outdated emission factors: As mentioned earlier, factor vintage matters. The UK grid factor dropped from 0.256 kg CO₂ per kWh in 2019 to 0.194 in 2023,a 24% decline. Using the older factor would significantly overstate your true footprint.
4. Missing scope 3 categories: It is common to report only purchased goods while ignoring transportation or waste. While focusing on material categories is acceptable initially, omitting major categories altogether undermines credibility.
The Calculation Process
Step A: Create a table with columns for:
- Emission source
- Activity data (quantity)
- Unit (kWh, liters, kg, metric tons)
- Emission factor (kg CO₂e per unit)
- Total CO₂e (quantity × factor)
Step B: Calculate each row.
Step C: Sum the scope 1 column, scope 2 column, and scope 3 column.
Step D: Add the scope totals to get your total organizational carbon footprint.
Example (simplified):
| Source | Activity | Unit | Factor (kg CO₂e/unit) | Total CO₂e (metric tons) |
|---|---|---|---|---|
| Natural gas (scope 1) | 500,000 | kWh | 0.184 | 92.0 |
| Diesel forklifts (scope 1) | 10,000 | liters | 2.68 | 26.8 |
| Refrigerant R-410A (scope 1) | 50 | kg | 2,088 | 104.4 |
| Grid electricity (scope 2) | 2,000,000 | kWh | 0.35 | 700.0 |
| Purchased steel (scope 3) | 500 | metric tons | 1.80 | 900.0 |
| Total | 1,823.2 |
Common Challenges and How to Overcome Them
Carbon footprint calculation is rarely straightforward the first time. Here are the most frequent obstacles manufacturers face and how to solve them.
Data gaps: You may lack accurate data for certain sources, especially scope 3. Solution: Use industry benchmarks or spend-based factors as proxies. For example, if you cannot get exact tonnage for purchased packaging, multiply your total packaging spend by a spend-based emission factor (e.g., kg CO₂e per dollar). Refine over time.
Lack of resources: Small and mid-sized manufacturers often have no dedicated sustainability staff. Solution: Start with scopes 1 and 2 only, which cover the sources you directly control. Once this baseline is established and you have buy-in from management, expand to scope 3.
Scope 3 complexity: The sheer number of categories can paralyze decision-making. Solution: Apply the 80/20 rule. Identify the three to five scope 3 categories that account for the majority of your upstream and downstream emissions. For most manufacturers, this means purchased goods, upstream transportation, and business travel.
Ensuring accuracy: Without verification, internal stakeholders may question the numbers. Solution: Engage a third-party verifier (such as SGS, Bureau Veritas, or DNV) to provide limited assurance on your first report. The cost is manageable,often $5,000-$15,000,and the credibility boost is significant.
Tools and Resources for Carbon Footprint Calculation
You do not need to build everything from scratch. A range of tools, from free to enterprise-grade, can simplify the process.
Free tools:
- EPA's Simplified GHG Emissions Calculator: Designed for small businesses, covers scope 1 and 2 with pre-loaded factors.
- Carbon Trust's SME Carbon Footprint Calculator: Tailored for UK-based small manufacturers.
- GHG Protocol's Calculation Tools: Spreadsheet-based tools for scope 1 and scope 2, plus specific tools for waste, transport, and other scope 3 categories.
Commercial software (often with free trials):
- Plan A: AI-powered platform with automated data collection and real-time tracking.
- Watershed: Enterprise software used by companies like OpenAI and Shopify.
- Salesforce Net Zero Cloud: Integrated with CRM and supply chain data for large manufacturers.
- EcoChain: Lifecycle assessment and carbon accounting combined.
Spreadsheet templates: The GHG Protocol provides free Excel templates for scope 1, scope 2, and seven scope 3 categories. These are ideal for getting started without investment.
Decision framework: If your annual revenue is under $50 million and you have one or two facilities, a spreadsheet template is sufficient. For multi-site operations exceeding $50 million, commercial software pays for itself through time savings and error reduction.
Frequently Asked Questions (FAQ)
1. What is the difference between carbon footprint and lifecycle assessment (LCA)?
A carbon footprint quantifies total GHG emissions across scopes 1, 2, and 3. A lifecycle assessment (LCA) is broader,it evaluates all environmental impacts of a product, including water use, land use, toxicity, and resource depletion, from raw material extraction to end-of-life. A carbon footprint is a component of an LCA.
2. How often should I update my emission factors?
Annually, at minimum. Energy grids, fuel mixes, and production processes change year to year. Using outdated factors will produce inaccurate results. Most reputable databases (DEFRA, EPA eGRID) update each spring with factors for the previous calendar year.
3. Does third-party verification add significant value to my carbon footprint?
Yes, especially if you are reporting to customers, investors, or regulators. Verified numbers carry greater credibility and reduce the risk of greenwashing accusations. Many large buyers now require limited assurance from their suppliers before accepting their sustainability data.
4. Can I start with a simplified approach and improve later?
Absolutely. Many leading manufacturers began with just scopes 1 and 2, using estimates for scope 3. The Science Based Targets initiative (SBTi) encourages companies to start with near-term targets even if their data quality is imperfect. The key is to document your methodology and continuously improve data quality over successive reporting periods.
Conclusion
Calculating your manufacturing carbon footprint is not a one-time project,it is an ongoing process that becomes faster, more accurate, and more valuable with each cycle. By following this structured approach,defining boundaries, collecting data, applying emission factors, and calculating totals,you gain the clarity needed to reduce emissions, meet regulations, and win customer trust.
The cost of inaction is mounting. Carbon taxes are expanding across Europe, North America, and Asia. Major OEMs are disqualifying suppliers who cannot provide verified carbon data. And your competitors are already ahead.
Start today. The data you already have,utility bills, fuel logs, purchase orders,is enough to begin. Refine as you go.
Download our free carbon footprint calculation template for manufacturing facilities to get started today. It includes pre-built spreadsheets for all three scopes, regional emission factors, and a step-by-step checklist.
Written with LLaMaRush ❤️